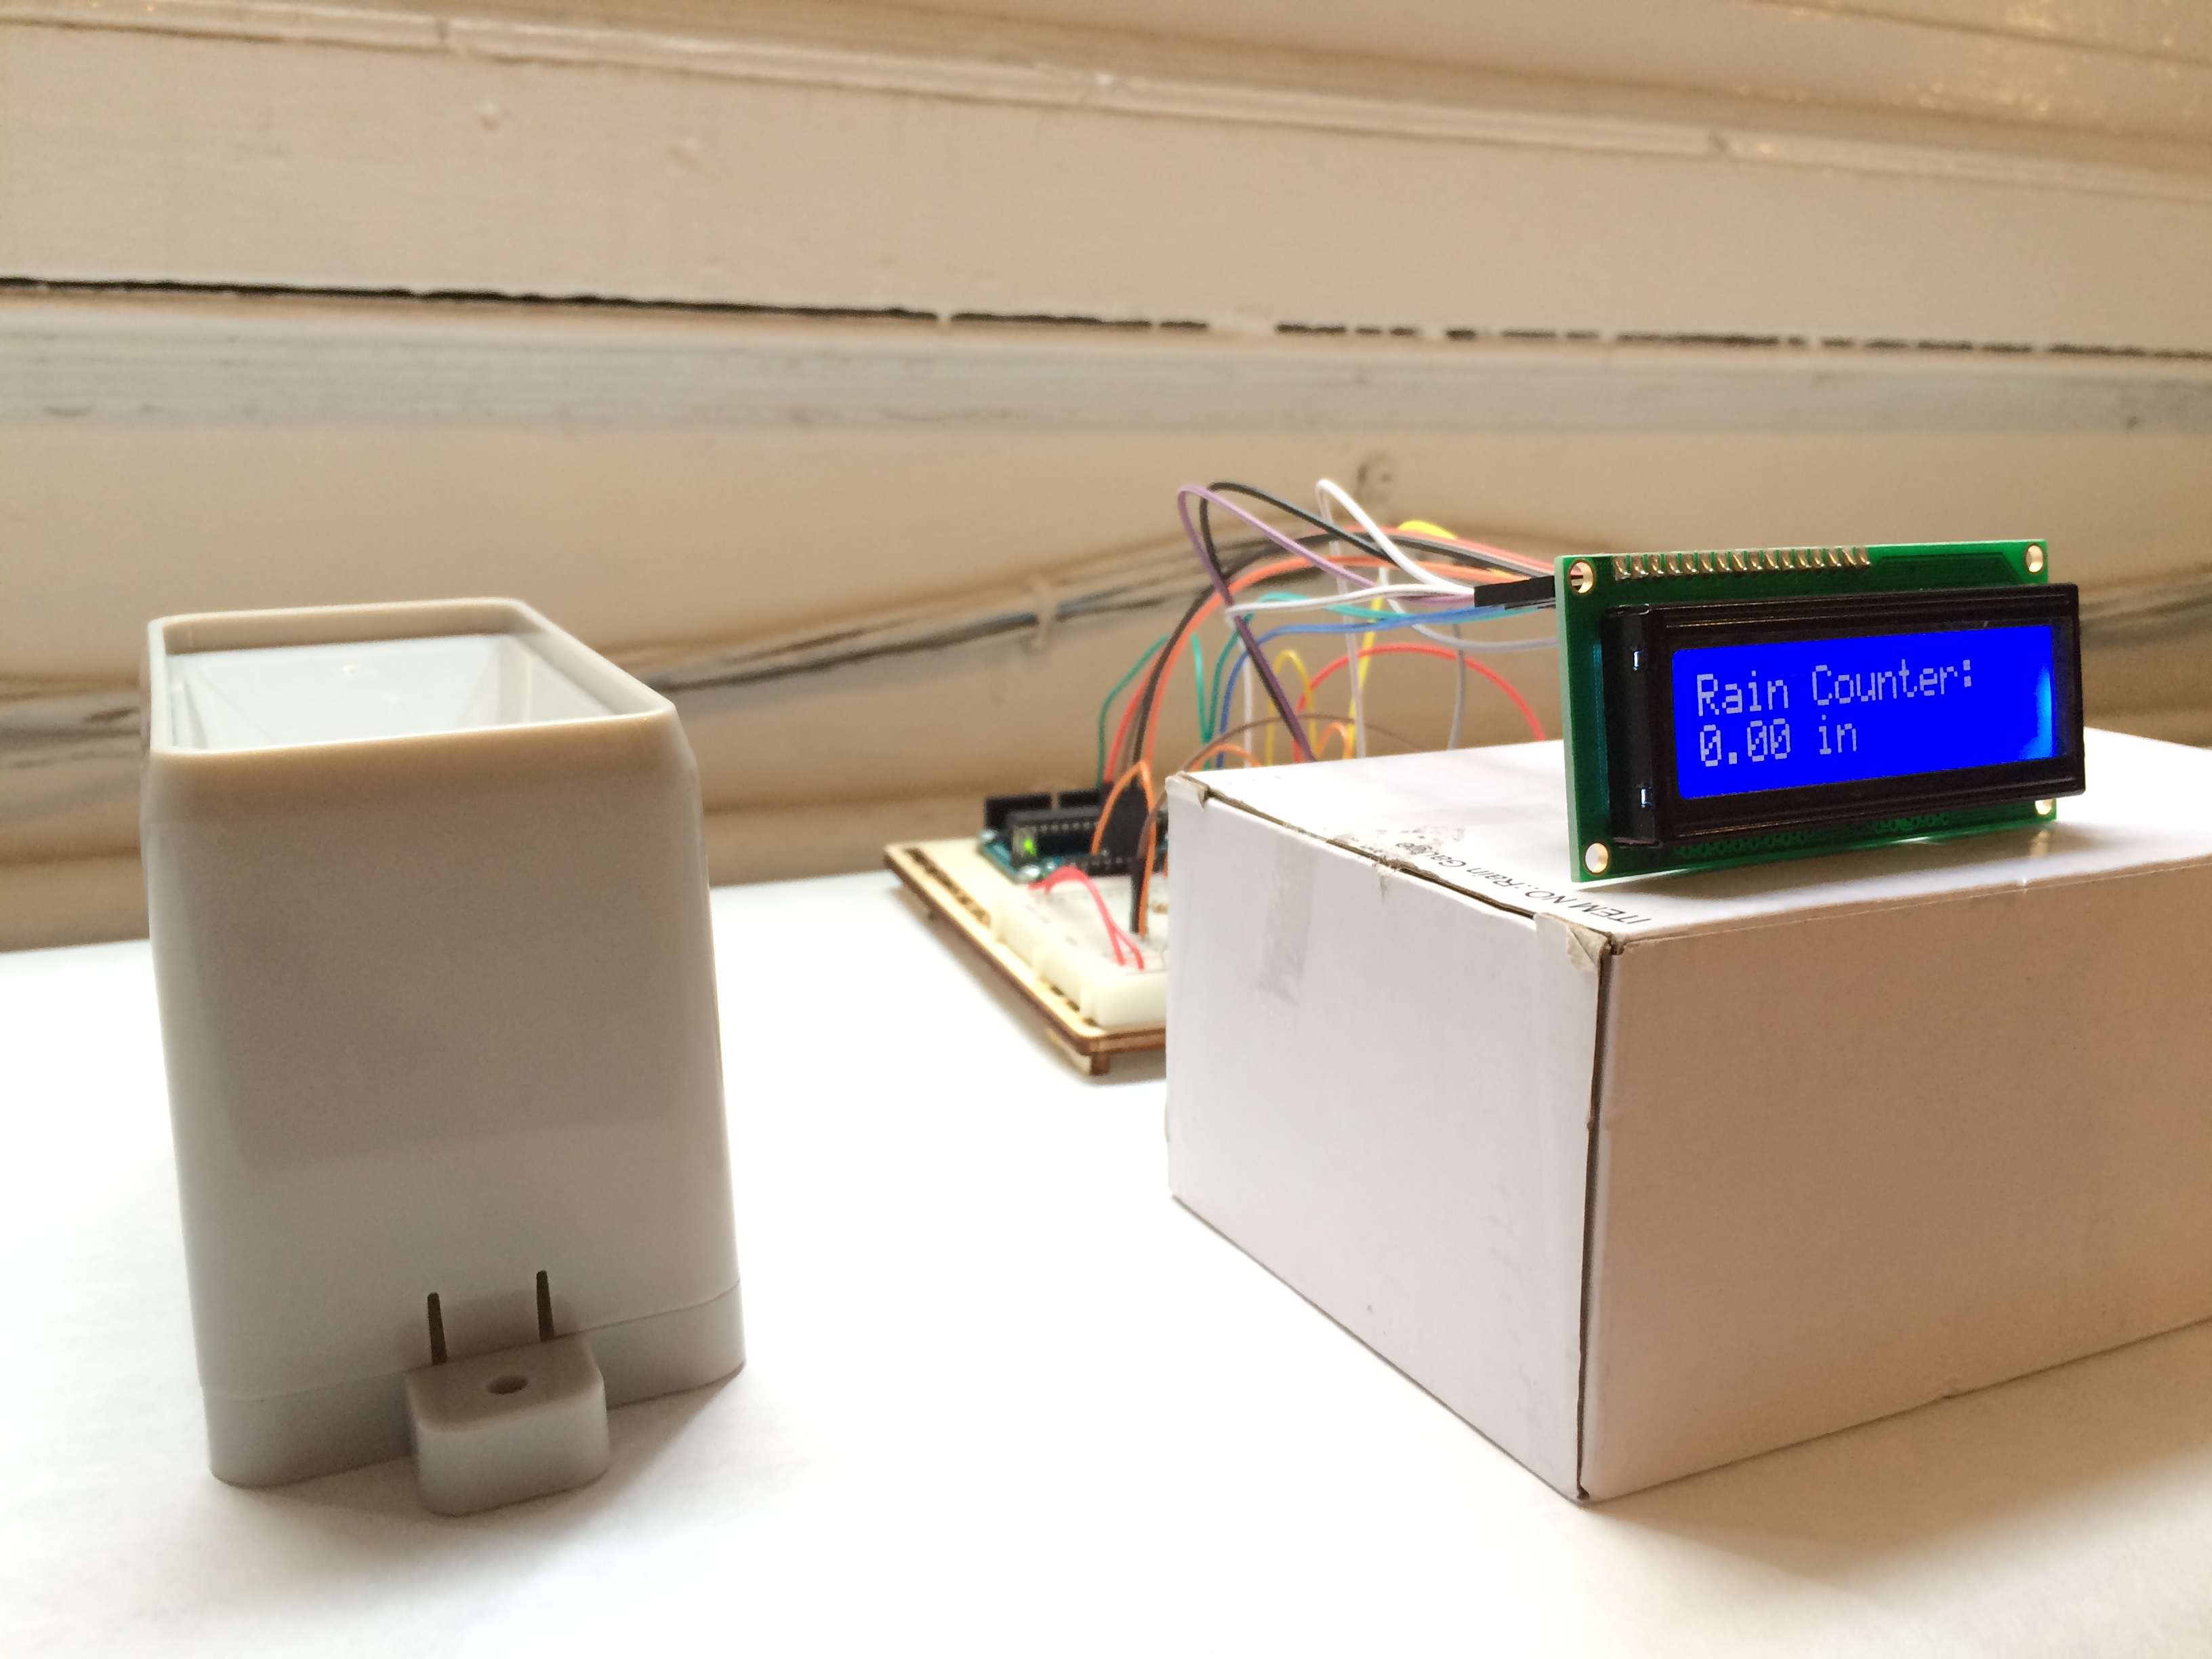
Measuring cumulative rainfall with a rain gauge.
I’ve spent about six years living in Utah, where the climate is arid and drought is a constant concern. According to the U.S. Drought Monitor, about a quarter of the state continues to experience severe (D2) level drought. The region often doesn’t receive the rainfall it needs to keep its reservoirs at capacity.
In keeping with my interest in humans’ relationship with their physical environment and ecological processes, I decided that I wanted my next project to collect information about precipitation.
Using a rain gauge that my friend Joao Costa had lent me, I was able to measure the accumulation of rainfall over time.
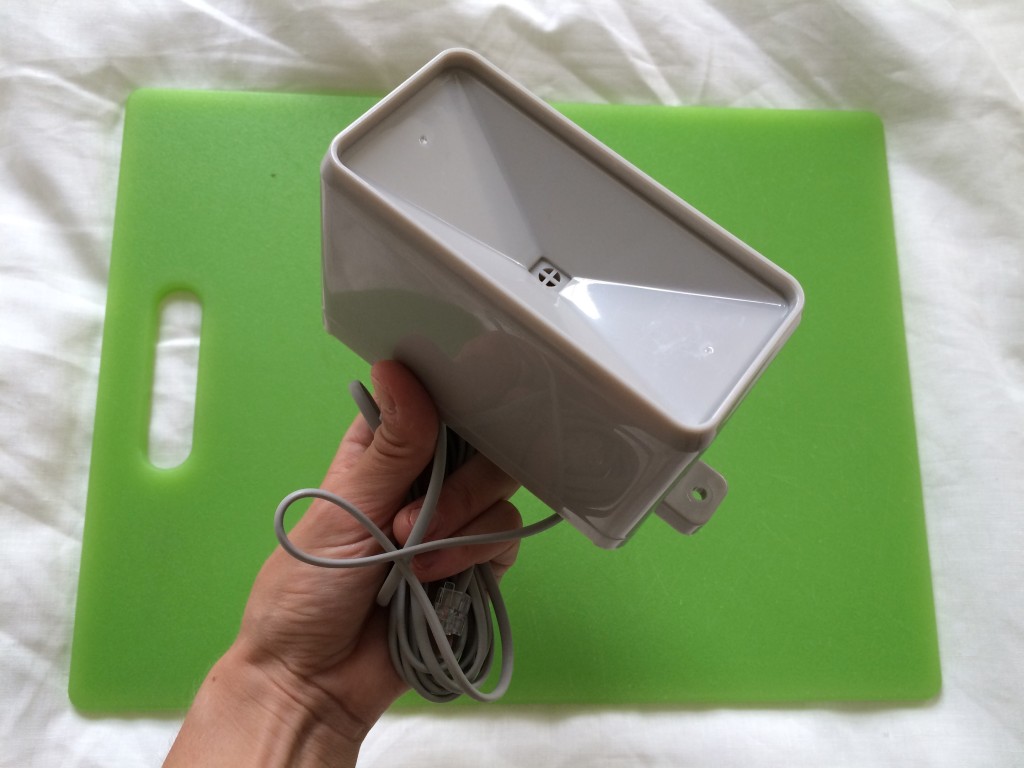

A rain gauge is a self-emptying tipping bucket that collects and dispenses water. It allows you to display daily and accumulated rainfall as well as the rate of rainfall. The gauge essentially acts as a switch, making contact when a specified amount of water enters the bucket.
Rain collects at the top of the bucket, where a funnel collects and channels the precipitation into a small seesaw-like container. After 0.011 inches (0.2794 mm) of rain has fallen, the lever tips and dumps the collected water. An electrical signal is sent back to the Arduino where the digital counter can record what’s called the “interrupt input.”
Once I decided that I wanted to measure the precipitation using the rain gauge, I did some research into the particular gauge I was using. According to its datasheet, the rain gauge connected to an adaptor, which then only connected to two center conductors. I hooked up the rain bucket like so:
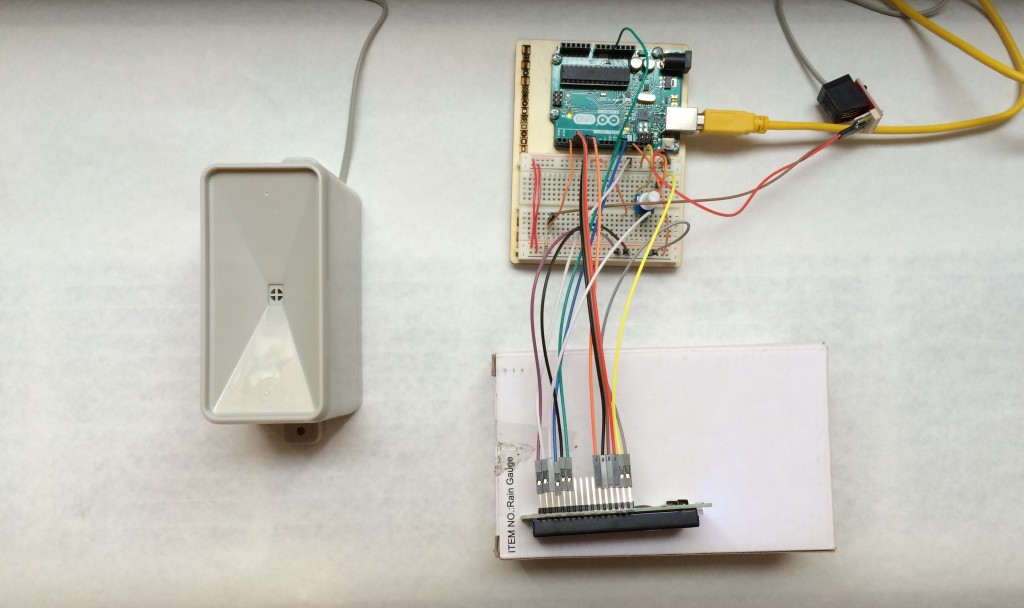
The thing that is really powerful about the rain gauge is that it can measure the cumulative rainfall over a period of time. I decided that I wanted to connect the LCD screen to the Arduino as an output in order to display the amount of precipitation.
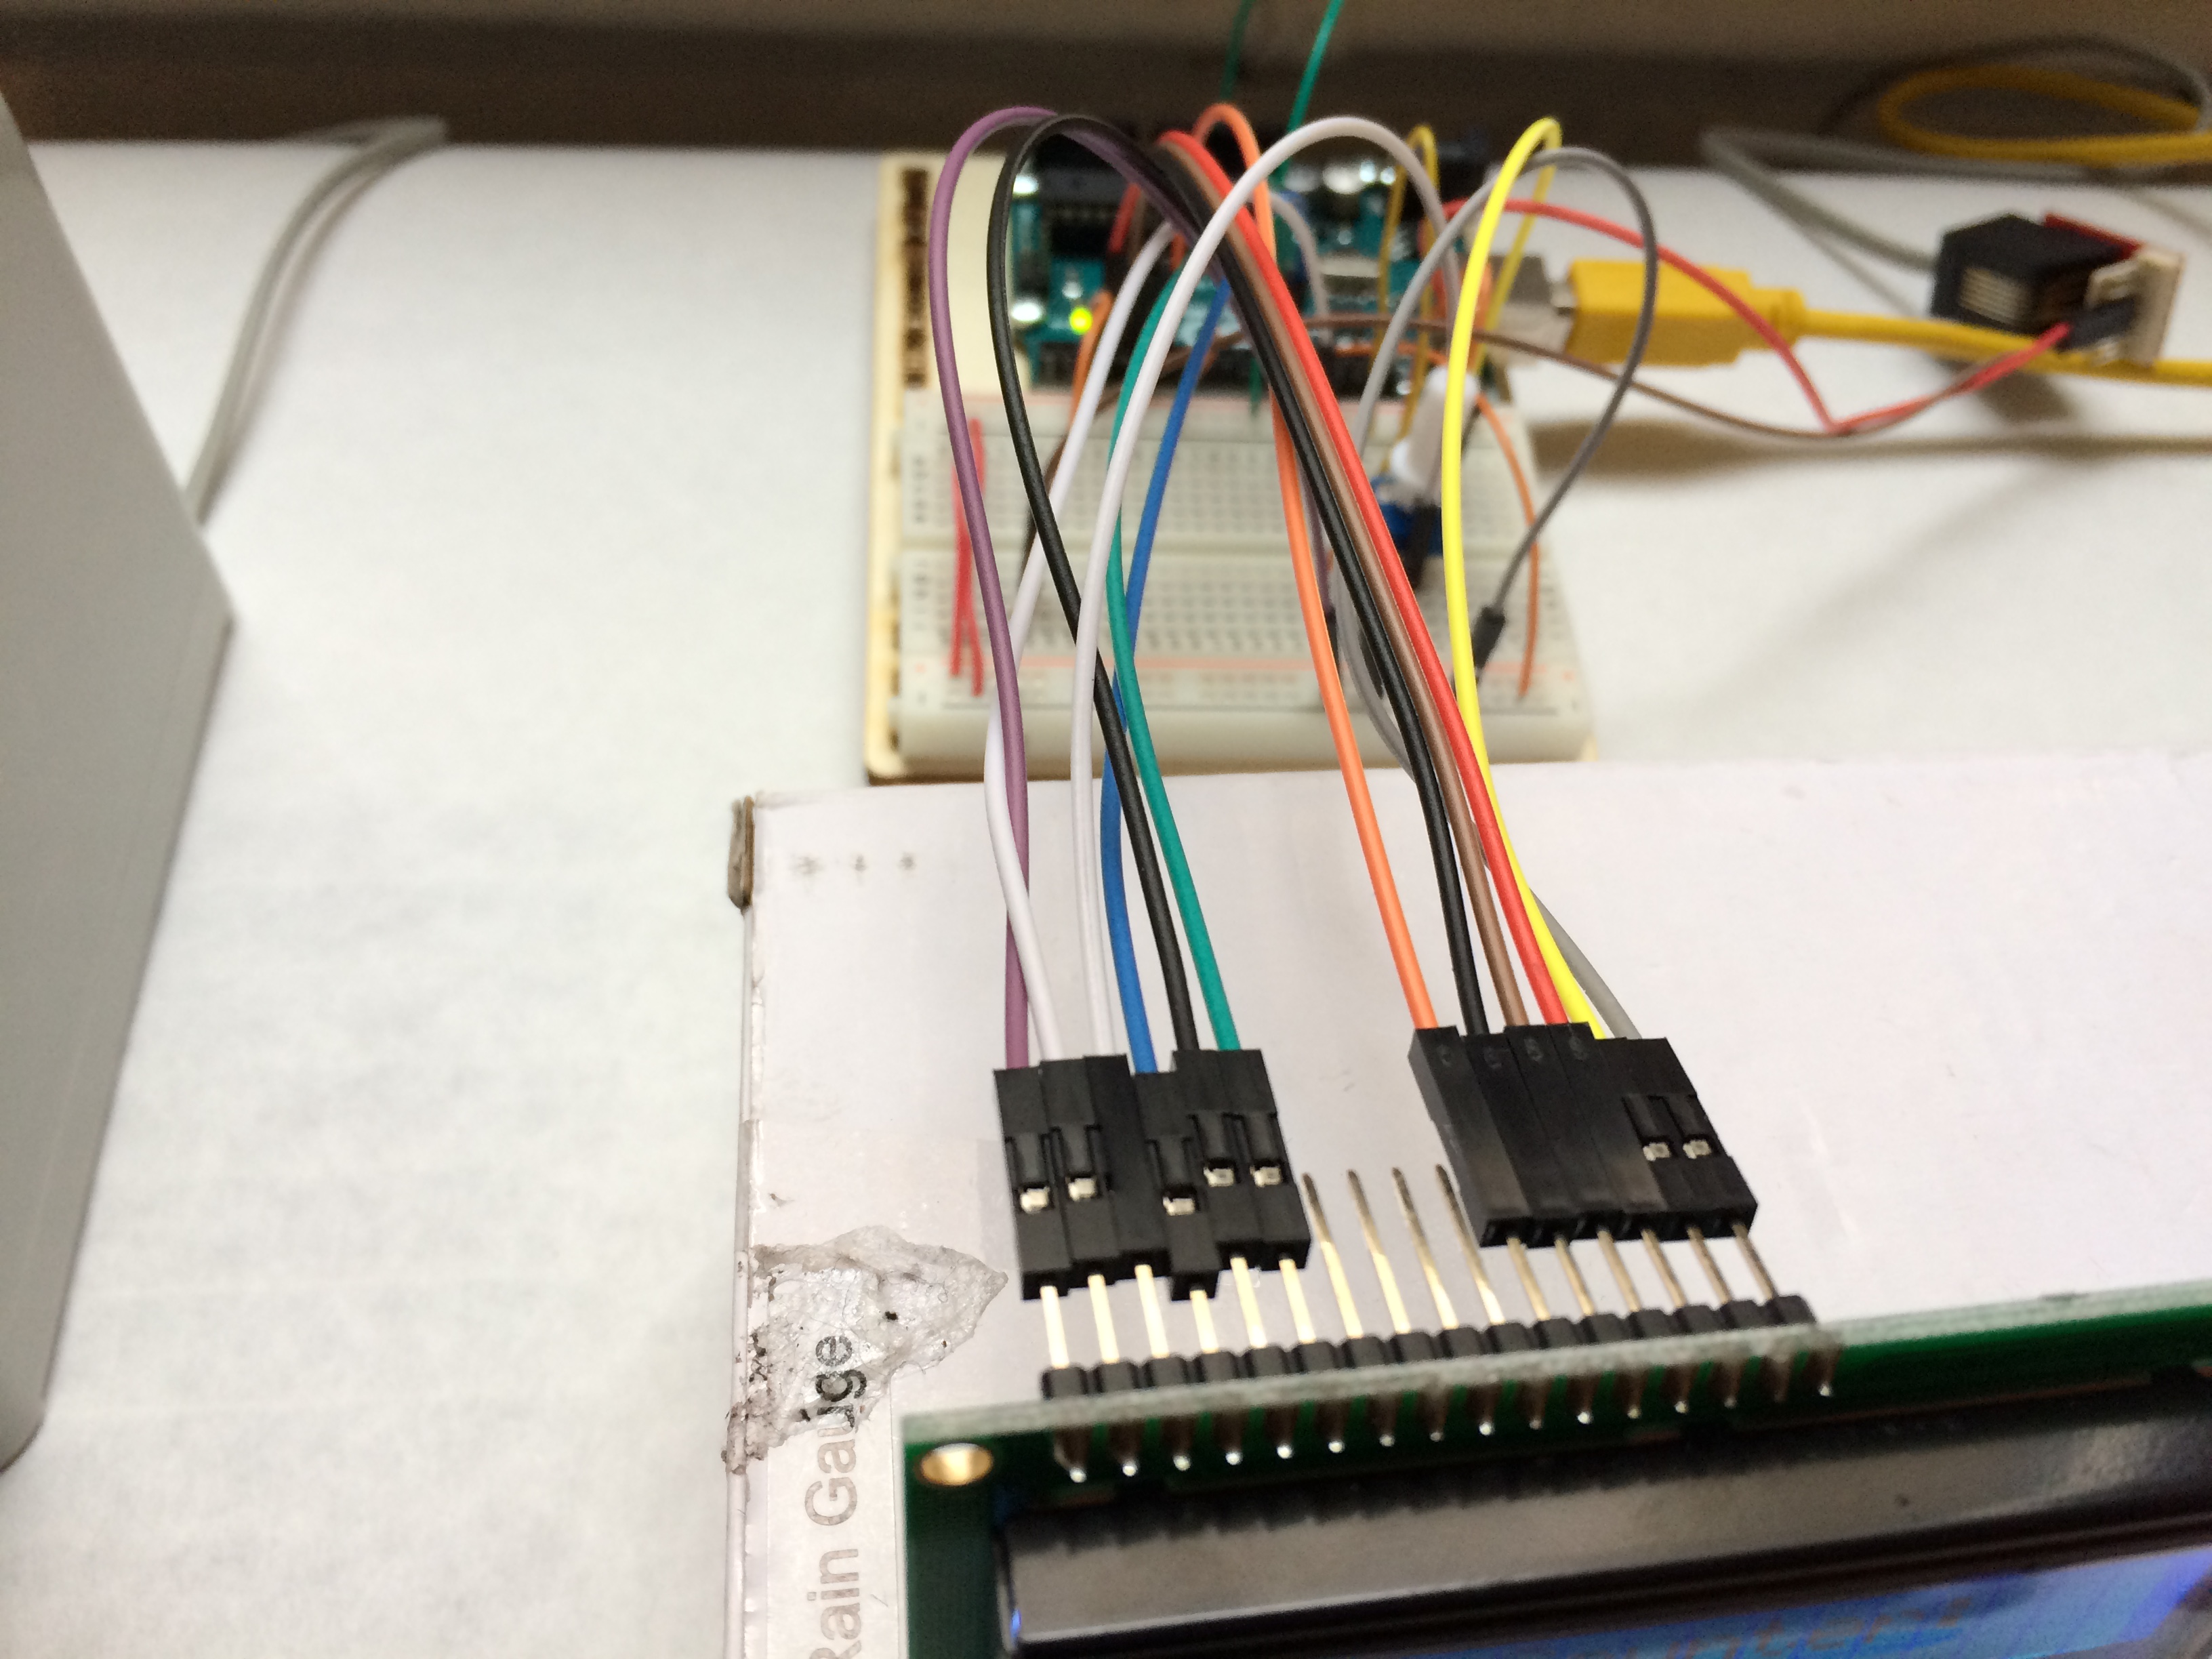
Connecting the LCD screen was very difficult because of the number of wires that needed to be connected to the screen (eight!). The LCD screen also required that I set up a potentiometer to control the brightness of the screen, so I added that to the breadboard.
Once the setup was complete, I wrote the Arduino program that would display the precipitation information I wanted. I figured out how to set up the LCD screen to display text on a single line.`
Next, I needed to figure out how to display the actual amount of precipitation that had fallen into the bucket. To do so, I created a variable “rainTipperCounter.” Every time the see-saw in the gauge filled with water and tipped, the count went up by one.
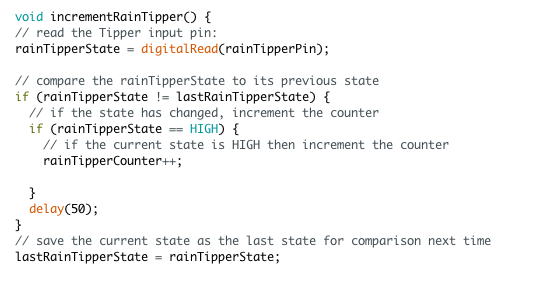
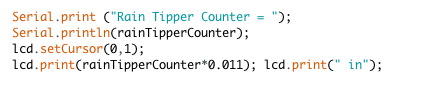
I knew that each time the count increased, 0.011 inches of rainfall had collected in the rain gauge. I programmed the LCD to display the rainTipperCounter, multiplied by 0.011, so that the actual amount of accumulated precipitation was displayed.
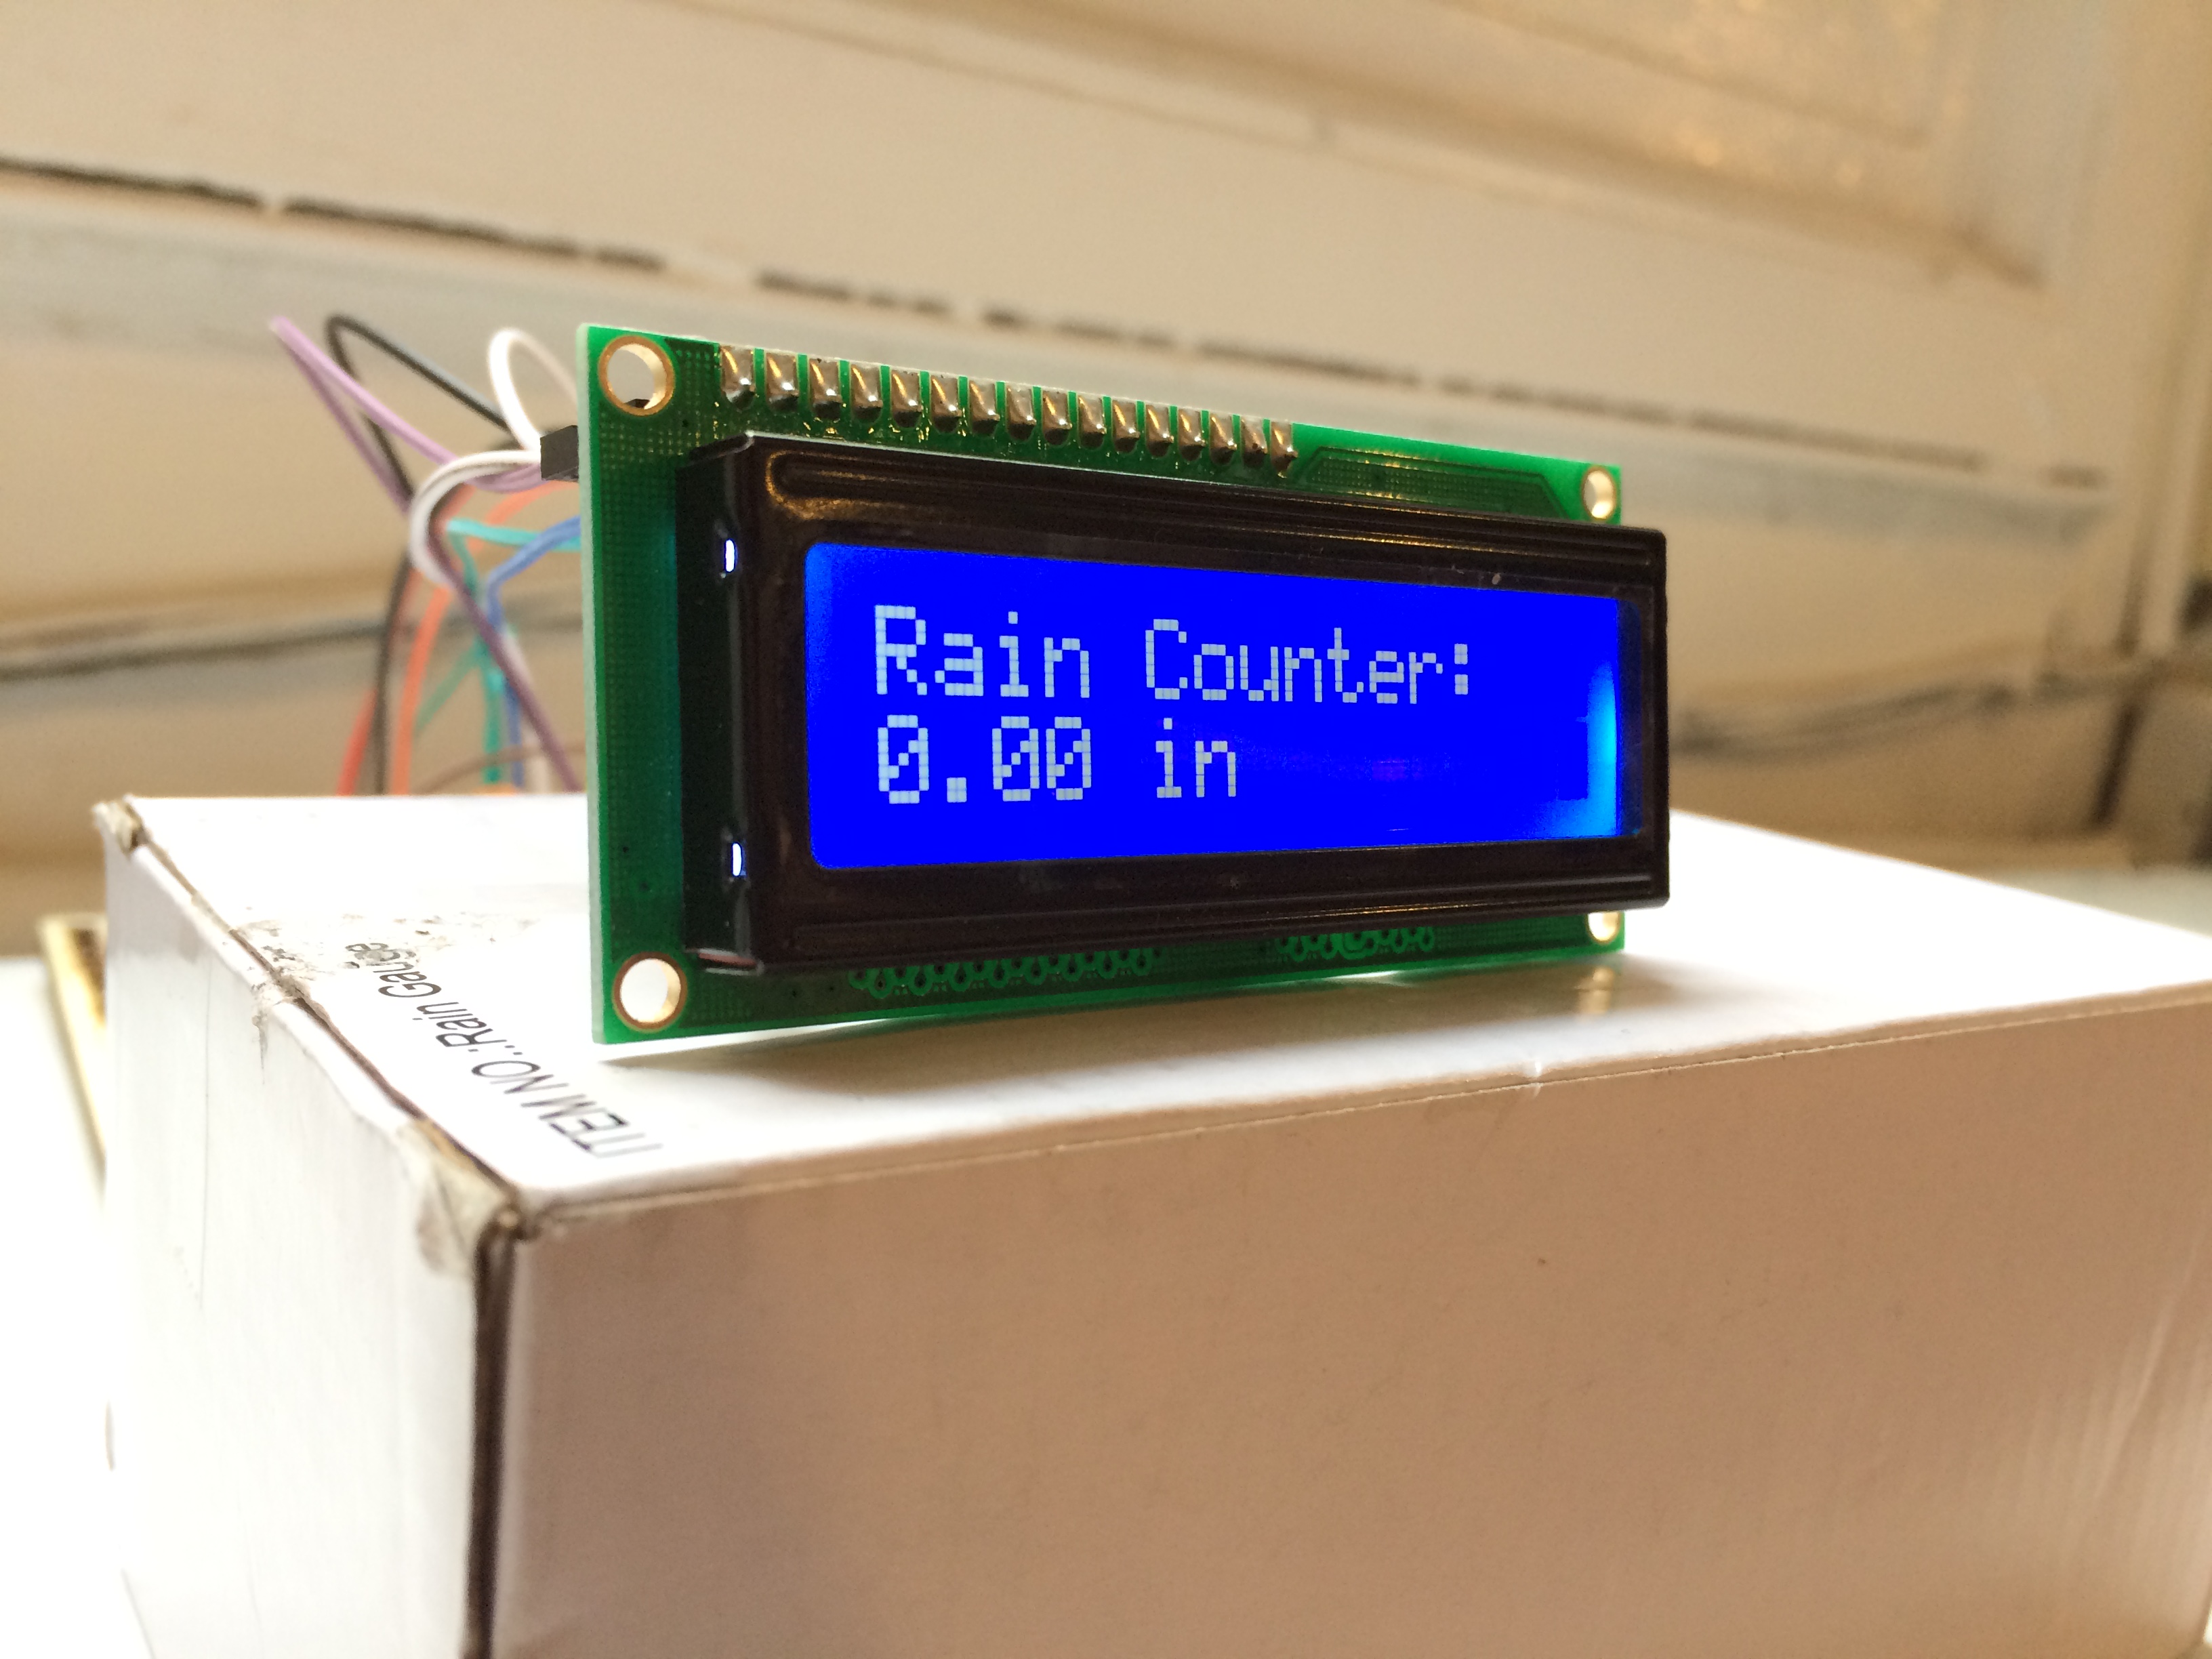
And just like that, I’d set up a simple rain gauge that tracked cumulative precipitation. It wasn’t raining outside today so I had to test the switch by pouring water into the gauge. Here’s how the final product turned out:


沒有留言:
張貼留言