SQLite and Node-RED

Sqlite is an extremely light weight database that does not run a server component.
In this blog I wanted to document how I used Node-Red to create, insert and view SQL data on a Raspberry Pi. I also wanted to show how to reformat the SQL output so that it could be viewed in a Node-Red Dashboard line chart.
Installation
Node-Red is pre-installed on the Pi Raspian image. I wasn’t able to install the Sqlite node using the Node-Red palette manager. Instead I did a manual install as per the directions at: https://flows.nodered.org/node/node-red-node-sqlite .
cd ~/.node-red npm i --unsafe-perm node-red-node-sqlite npm rebuildCreate a Database and Table
It is possible to create a database and table structures totally in Node-Red.
I connected a manual inject node to a sqlite node.
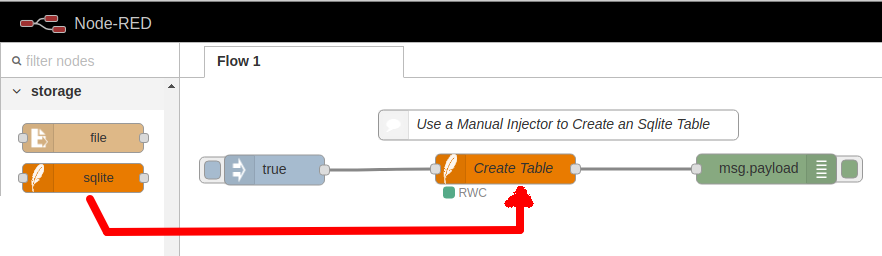
In the sqlite node an SQL create table command is used to make a new table. Note: the database file is automatically created.
For my example I used a 2 column table with a timestamp and a value

Insert Data into Sqlite
Data can be inserted into Sqlite a number of different ways. A good approach for a Rasp Pi is to pass some parameters into an SQL statement.

The sqlite node can use a “Prepared Statement” with a msg.params item to pass in data. For my example I created two variable $thetime and $thevalue.

A function node can be used to format a msg.params item.
1 2 3 4 5 | // Create a Params variable// with a time and value component//msg.params = { $thetime:Date.now(), $thevalue:msg.payload }return msg; |
Viewing Sqlite Data
A “select” statement is used in an sqlite node to view the data.
A simple SQL statement to get all the data for all the rows in this example would be:
select * from temps;A debug node can used to view the output.
Custom Line Chart
Node-Red has a nice dashboard component that is well formatted for web pages on mobile devices.
To add the dashboard components use the Node-Red palette manager and search for: node-red-dashboard.
By default the chart node will create its own data vs. time storage. For many applications this is fine however if you want long term storage or customized historical plots then you will need to pass all the trend data to the chart node.
For some details on passing data into charts see: https://github.com/node-red/node-red-dashboard/blob/master/Charts.md#stored-data
Below is an example flow for creating a custom chart with 3 values with times.
The JavaScript code needs to create a structure with: series, data and labels definitions
1 2 3 4 5 6 7 8 9 10 11 12 | msg.payload = [{"series": ["A"],"data": [[{ "x": 1577229315152, "y": 5 },{ "x": 1577229487133, "y": 4 },{ "x": 1577232484872, "y": 6 }]],"labels": ["Data Values"]}];return msg; |
This will create a simple chart:

For reference, below is an example of the data structure for three I/O points with timestamps:
1 2 3 4 5 6 7 8 9 10 11 12 13 14 15 16 17 18 19 20 | // Data Structure for: Three data points with timestampsmsg.payload = [{"series": ["A", "B", "C"],"data": [[{ "x": 1577229315152, "y": 5 },{ "x": 1577229487133, "y": 4 },{ "x": 1577232484872, "y": 2 }],[{ "x": 1577229315152, "y": 8 },{ "x": 1577229487133, "y": 2 },{ "x": 1577232484872, "y": 11 }],[{ "x": 1577229315152, "y": 15 },{ "x": 1577229487133, "y": 14 },{ "x": 1577232484872, "y": 12 }]],"labels": ["Data Values"]}]; |
Sqlite Data in a Line Chart
To manually update a line chart with some Sqlite data I used the following nodes:
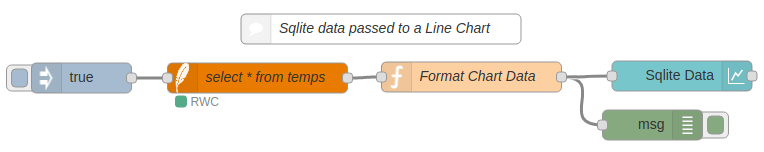 The SQL select statement will vary based on which time period or aggregate data is required. For the last 8 values I used:
select * from temps LIMIT 8 OFFSET (SELECT COUNT(*) FROM temps)-8;The challenging part is to format the SQL output to match the required format for the Line Chart. You will need to iterate over each data row (payload object) and format a JSON string.
 //
 // Create a data variable
 //
 var series = ["temp DegC"];
 var labels = ["Data Values"];
 var data = "[[";

 for (var i=0; i < msg.payload.length; i++) {
   data += '{ "x":' + msg.payload[i].thetime + ', "y":' + msg.payload[i].thetemp + '}';
   if (i < (msg.payload.length - 1)) {
     data += ","
   } else {
     data += "]]"
   }
 }
 var jsondata = JSON.parse(data);
 msg.payload = [{"series": series, "data": jsondata, "labels": labels}];


 return msg;
To view the Node-Red Dashboard enter: http://pi_address:1880/ui

Final Comments
For a small standalone Raspberry Pi project using sqlite as a database is an excellent option. Because a Pi is limited in data storage I would need to include a function to limit the amount of data stored.


沒有留言:
張貼留言